

A step-by-step guide in designing knowledge-driven models using Bayesian theorem.
In case you don’t have data but there is expert’s knowledge. A starters guide to convert knowledge into computer-aided models.
Data is the fuel for models but you may have witnessed situations where there is no data but solely a domain expert that can very well describe or even predict “the situation” given the circumstances. I will summarize the concepts of knowledge-driven models in terms of Bayesian probabilistic, followed by a hands-on tutorial to demonstrate the steps of converting an expert’s knowledge into a Bayesian model with the goal to make inferences. I will use the Sprinkler system to conceptually explain the steps in the process: from knowledge to model. I will end with a discussion about the challenges of complex knowledge-driven models, and the systematic errors that can occur due to questioning and extracting knowledge. All examples are created using the python library bnlearn.
Can we get expert’s knowledge into models?
When we talk about knowledge, it is not solely descriptive knowledge such as facts. Knowledge is also a familiarity, awareness, or understanding of someone or something, procedural knowledge (skills), or acquaintance knowledge [1].
Whatever knowledge you have, or want to use, it needs to be presented in a computer interpretable manner if you want to build a computer aided knowledge model.
This means that you need to design a system that is built on a sequence of process stages. Or in other words, a sequence goes from the output of the process into the input in the next process. Multiple simple sequences can then be combined into a complex system. We can represent such a system as a graph with nodes and edges. Each node corresponds to a variable and each edge represents conditional dependencies between pairs of variables. In this manner, we can define a model based on the expert’s knowledge, and the best way to do that is with Bayesian models. To answer the question, ‘Can we get experts knowledge into models?’ Well, it depends on how accurate you can represent the knowledge as a graph and how precise you can glue it together by probability theorem a.k.a. Bayesian graphical models. Still, there are some restrictions though.
Bayesian graphical models are ideal to create knowledge-driven models.
The use of machine learning techniques has become a standard toolkit to obtain useful insights and make predictions in many domains. However, many of the models are data-driven, which means that data is required to learn a model. Incorporating expert’s knowledge in data-driven models is not possible or straightforward to do. However, a branch of machine learning is Bayesian graphical models (a.k.a. Bayesian networks, Bayesian belief networks, Bayes Net, causal probabilistic networks, and Influence diagrams), which can be used to incorporate experts knowledge into models and make inferences. See below some bullet points with the advantages of Bayesian graphical models, which I will stress throughout this article.
- The possibility to incorporate domain/expert knowledge in a graph.
- It has a notion of modularity.
- A complex system is built by combining simpler parts.
- Graph theory provides intuitively highly interacting sets of variables.
- Probability theory provides the glue to combine the parts.
To make Bayesian graphical models, you need two ingredients: 1. Directed Acyclic Graphs (DAG) and 2. Conditional Probabilistic Tables (CPTs). Only together it can form a representation of the expert’s knowledge.
Part 1: Bayesian Graphs are Directed Acyclic Graphs (DAG)
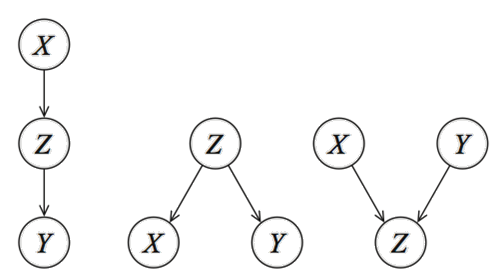
At this point, you know that knowledge can be represented as a systematic process, and can be seen as a graph. In the case of Bayesian models, a graph needs to be represented as a DAG. But what exactly is a DAG? First of all, it stands for Directed Acyclic Graphs and is a network (or graph) with nodes (variables) and edges that are directed. Figure 1 depicts three unique patterns that can be made with three variables (X, Y, Z). Nodes correspond to variables X, Y, Z, and the directed edges (arrows) indicate dependency relationships or conditional distributions. The network is acyclic, which means that no (feedback) loops are allowed.
With a DAG, a complex system can be created by combining the (simpler) parts.

All DAGs (large or small) are built under the following 3 rules:
- Edges are causal relationships.
- Edges are directed.
- Feedback loops are not allowed.
These rules are important because if you would remove the directionality (or arrows), the three DAGs become identical. Or in other words, with the directionality, we can make the DAG identifiable [2]. There are many blogs, articles, and Wikipedia pages that describe the statistics and causality behind the DAGs. What you need to understand is that every Bayesian network can be designed by these three unique patterns, and should be representative of the process you want to model. Designing the DAG is the first part of creating a knowledge-driven model. The second part is defining the Conditional Probabilistic Tables which describe the strength of the relationship at each node in terms of (conditional) probabilities.
Part 2: Define the Conditional Probabilistic Tables to describe the strength of the node relationships.
Probability theory (a.k.a. Bayes theorem or Bayes Rule), forms the fundament for Bayesian networks. Check out this medium article about Bayesian structure learning [3] to read more about the specific parts of Bayes theorem. Although the theorem is applicable here too, there are some differences. First, in a knowledge-driven model, the CPTs are not learned from data (because there is none). Instead, the probabilities need to be derived from the expert by questioning, and subsequently being stored in so-called Conditional Probabilistic Tables (CPT) (also named Conditional Probability Distribution, CPD). I will use CPT and CPD interchangeably throughout this article.
The CPTs describes the strength of the relationship at each node in terms of conditional probabilities or priors.
The CPTs are then used with the Bayes rule to update model information which allows making inferences. In the next section, I will demonstrate, with the Sprinkler use case, how to exactly fill in the CPT with expert knowledge. But first, there are challenges in converting expert's knowledge into probabilities.
Converting experts knowledge into probabilities
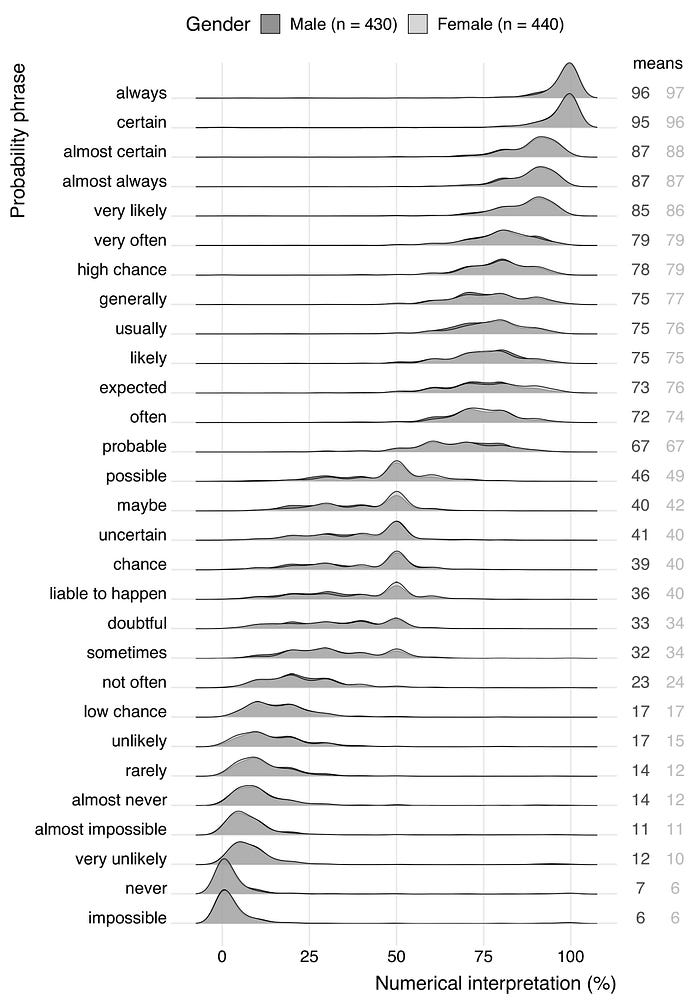
When we want to make a knowledge-driven model, it is crucial to extract the right information from the expert. The domain expert will inform about the probability of a successful process and the risks of side effects. It is utterly important that the message is understood as intended to minimize the risk of miscommunication. When talking to experts, many estimated probabilities are communicated verbally, with terms such as ‘very likely’ instead of exact percentages.
Make sure that the verbal probability phrase is the same for both sender and receiver in terms of probabilities or percentages.
In certain domains there are guidelines that describe terms such as ‘common’ in certain ranges, let say 1–10%. But without background knowledge of the domain, the word ‘common’ can easily be interpreted as a different number [4]. In addition, the interpretation of a probability phrase can be influenced by its context [4]. For instance, compare your numerical interpretation in the next two statements:
- It will likely rain in Manchester (England) next June.
- It will likely rain in Barcelona (Spain) next June.
Probably, your numerical interpretation of ‘likely’ in the first statement is higher than in the second. Be cautious of contextual misinterpretations as it can also lead to systematic errors and thus incorrect models. An overview figure of probability phrases is shown in Figure 2.
‘Impossible’ seems not always be impossible!

The bnlearn library.
A few words about the bnlearn library that is used for all the analysis in this article. The bnlearn library is designed to tackle a few challenges such as:
- Structure learning: Given the data: Estimate a DAG that captures the dependencies between the variables.
- Parameter learning: Given the data and DAG: Estimate the (conditional) probability distributions of the individual variables.
- Inference: Given the learned model: Determine the exact probability values for your queries.
What benefits does bnlearn offer over other bayesian analysis implementations?
- Build on top of the pgmpy library
- Contains the most-wanted bayesian pipelines
- Simple and intuitive
- open source
- Documentation page
Building a sprinkler system based on expert's knowledge.
Let's start with a simple and intuitive example to demonstrate the building of a real-world model based on an expert's knowledge. In this use case, I will play the role of domain expert of the Sprinkler system.
Suppose I have a sprinkler system in my backyard and for the last 1000 days I have eye-witnessed how and when it works. I did not collect any data but I created an intuition about the working. Let’s call this an experts view or domain knowledge. Note that the sprinkler system is a well-known example in Bayesian networks.
From my expert’s view, I know some facts about the system; it is sometimes on and sometimes off (isn’t it great). I have seen -very often- that if the sprinkler system is on, the grass is -possibly- wet. However, I also know that rain -almost certainly- results in wet grass too and that the sprinkler system is then -most of the time- off. I know that clouds are -often- present before it starts to rain. Finally, I noticed a -weak- interaction between Sprinkler and Cloudy but I’m not entirely sure.
From this point on you need to convert the expert’s knowledge into a model. This can be done systematically by first creating the graph and then define the CPTs that connect the nodes in the graph.
A sprinkler system consists of four nodes, each with two states.
There are four nodes in the sprinkler system that you can extract from the expert's view. Each node works with two states: Rain: yes or no, Cloudy: yes or no, Sprinkler system: on or off, and Wet grass: true or false.
Define simple one-to-one relationships.
A complex system is built by combining simpler parts. This means that you don’t need to create or design the whole system at once but first define the simpler parts. The simpler parts are one-to-one relationships. In this step, we will convert the expert’s view into relationships. We know from the expert that: rain depends on the cloudy state, wet grass depends on the rain state but wet grass also depends on the sprinkler state. Finally, we know that sprinkler depends on cloudy. We can make the following four directed one-to-one relationships.
- Cloudy → Rain
- Rain → Wet Grass
- Sprinkler → Wet Grass
- Cloudy → Sprinkler
It is important to realize that there are differences in the strength of the relationships between the one-to-one parts and needs to be defined using the CPTs. But before stepping into the CPTs, let’s first make the DAG using bnlearn.
A DAG is based on one-to-one relationships.
The four directed relationships can now be used to build a graph with nodes and edges. Each node corresponds to a variable and each edge represents a conditional dependency between pairs of variables. In bnlearn, we can assign and graphically represent the relationships between variables.
pip install bnlearn
In figure 3 is the resulting DAG. We call this a causal DAG because we have assumed that the edges we encoded represent our causal assumptions about the sprinkler system.

At this point, the DAG has no knowledge about the underlying dependencies. We can check the CPTs with bn.print(DAG) which will result in the message that “no CPD can be printed”. We need to add knowledge to the DAG with so-called Conditional Probabilistic Tables (CPTs) and we will rely on the expert’s knowledge to fill the CPTs.
Knowledge can be added to the DAG with Conditional Probabilistic Tables (CPTs).
Setting up the Conditional Probabilistic Tables.
The sprinkler system is a simple Bayesian network where Wet grass (child node) is influenced by two-parent nodes (Rain and Sprinkler) (see figure 1). The nodes Sprinkler and Rain are influenced by a single node; Cloudy. The Cloudy node is not influenced by any other node.
We need to associate each node with a probability function that takes, as input, a particular set of values for the node’s parent variables and gives (as output) the probability of the variable represented by the node. Let’s do this for the four nodes.
CPT: Cloudy
The Cloudy node has two states (yes or no) and no dependencies. Calculating the probability is relatively straightforward when working with a single random variable. From my expert view across the last 1000 days, I have eye-witnessed 70% of the time cloudy weather (I’m not complaining though, just disappointed). As the probabilities should add up to 1, not cloudy should be 30% of the time. The CPT looks as following:
CPT: Rain
The Rain node has two states and is conditioned by Cloudy, which also has two states. In total, we need to specify 4 conditional probabilities, i.e., the probability of one event given the occurrence of another event. In our case; the probability of the event Rain that occurred given Cloudy. The evidence is thus Cloudy and the variable is Rain. From my expert's view I can tell that when it Rained, it was also Cloudy 80% of the time. I did also see rain 20% of the time without visible clouds (Really? Yes. True story).
CPT: Sprinkler
The Sprinkler node has two states and is conditioned by the two states of Cloudy. In total, we need to specify 4 conditional probabilities. Here we need to define the probability of Sprinkler given the occurrence of Cloudy. The evidence is thus Cloudy and the variable is Rain. I can tell that when the Sprinkler was off, it was Cloudy 90% of the time. The counterpart is thus 10% for Sprinkler is true and Cloudy is true. Other probabilities I’m not sure about, so I will set it to 50% of the time.
CPT: Wet grass
The wet grass node has two states and is conditioned by two-parent nodes; Rain and Sprinkler. Here we need to define the probability of wet grass given the occurrence of rain and sprinkler. In total, we have to specify 8 conditional probabilities (2 states ^ 3 nodes).
- As an expert, I am certain, let’s say 99%, about seeing wet grass after raining or sprinkler was on: P(wet grass=1 | rain=1, sprinkler =1) = 0.99. The counterpart is thus P(wet grass=0| rain=1, sprinkler =1) = 1 – 0.99 = 0.01
- As an expert, I am entirely sure about no wet grass when it did not rain or the sprinkler was not on: P(wet grass=0 | rain=0, sprinkler =0) = 1. The counterpart is thus: P(wet grass=1 | rain=0, sprinkler =0) = 1 – 1= 0
- As an expert, I know that wet grass almost always occurred when it was raining and the sprinkler was off (90%). P(wet grass=1 | rain=1, sprinkler=0) = 0.9. The counterpart is: P(wet grass=0 | rain=1, sprinkler=0) = 1 – 0.9 = 0.1.
- As an expert, I know that Wet grass almost always occurred when it was not raining and the sprinkler was on (90%). P(wet grass=1 | rain=0, sprinkler =1) = 0.9. The counterpart is: P(wet grass=0 | rain=0, sprinkler =1) = 1 – 0.9 = 0.1.
This is it! At this point, we defined the strength of the relationships in the DAG with the CPTs. Now we need to connect the DAG with the CPTs.